October 2021 National Disability Employment Awareness Month Infographics
The Autistic Women & Nonbinary Network recognizes October as National Disability Employment Awareness Month. We have created these graphics to illustrate the issues facing autistic people in the areas of employment, designed by our Art Director Erin Casey.
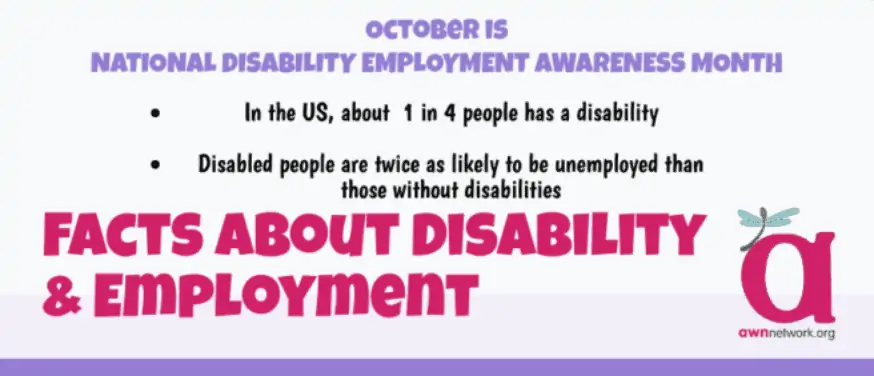
In the US, about 1 in 4 people has a disability. Disabled people are much more likely to be unemployed than those without disabilities, and the situation for disabled people in the workplace has only worsened since COVID. In 2019, 19.3% of disabled people were employed, whereas in 2020, only 17.9% of disabled people were employed.
Sexism, racism, and other forms of bias and discrimination are additional factors that affect many disabled people working or seeking employment. Unemployment rates are significantly higher for Latine disabled people (16.8%), Black disabled people (16.3%), and AAPI disabled people (15.7%) than white disabled people (11.6%). In addition,13.2% of women are unemployed compared to 12% of men.
Disabled people are also much less likely to be in leadership roles. And according to the US Bureau Labor Statistics Disability Equality Index (DEI), which surveyed 319 businesses, only 10% of companies have a senior executive who identifies as a person with a disability.
Learn more in the infographics below! Each of them has alt-text for accessibility, with image descriptions at the bottom of this post.
![October is NATIONAL DISABILITY EMPLOYMENT AWARENESS MONTH In the US, about 1 in 4 people has a disability Disabled people are twice as likely to be unemployed than those without disabilities Facts about Disability & Employment: [Chart of side by side facts about Disabled People vs Non-disabled people] Employment rates: In 2019, 19.3% of disabled people were employed. In 2020, only 17.9% of disabled people were employed. In 2019, 66.3% of non-disabled people were employed. In 2020, 61.8% of non-disabled people were employed. Unemployment rates: In 2019, the unemployment rate for disabled people was 7.3% As of 2020, the unemployment rate for disabled people was 12.6% In 2019, the unemployment rate for non-disabled people was 3.5% As of 2020, the unemployment rate for non-disabled people was 7.9% Education: Disabled people are less likely to have completed a Bachelor's degree or higher education; however, Across all educational attainment groups, unemployment rates for disabled people are higher than those for people without a disability. Part Time: In 2020, about 29% of employed people with disabilities worked part-time. About 6% of this group were part-time for economic reasons; i.e., had hours reduced or couldn't find a full-time position In 2020, about 16% of employed people without disabilities worked part-time. About 5% of this group were part-time for economic reasons; i.e., had hours reduced or couldn't find a full-time position. In the top right: the AWN logo: a large pink “a” with a teal spoonie dragonfly on it.](https://awnnetwork.org/wp-content/uploads/2021/10/000-656x1024.webp)
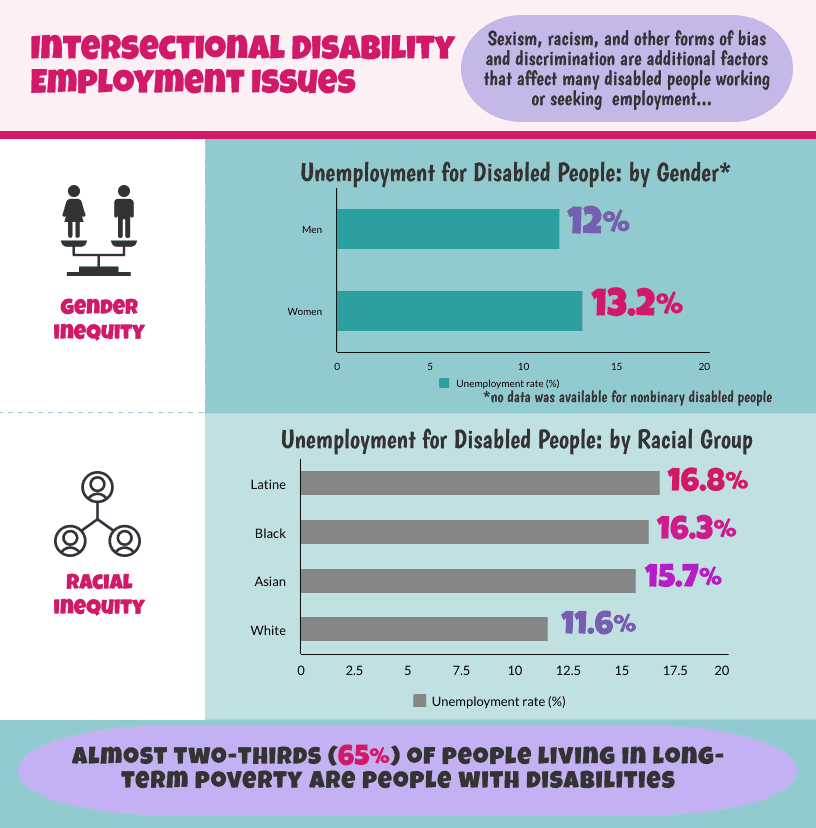
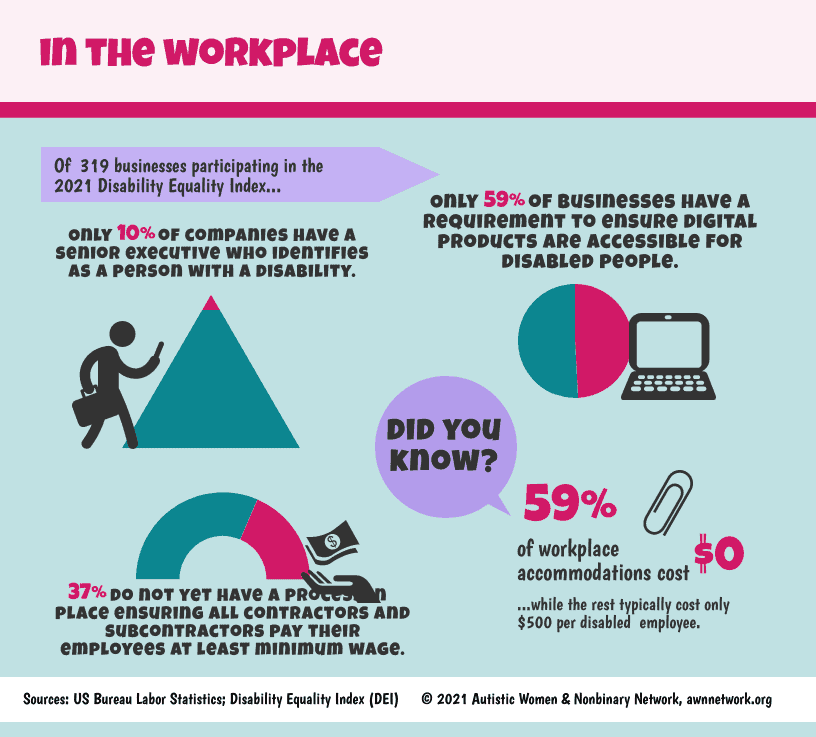
Image Description, graphic 1:
Text is in pink, purple, black and teal and reads:October is NATIONAL DISABILITY EMPLOYMENT AWARENESS MONTH
- In the US, about 1 in 4 people has a disability
- Disabled people are twice as likely to be unemployed than those without disabilities
Facts about Disability & Employment: [Chart of side by side facts about Disabled People vs Non-disabled people]
Employment rates:
In 2019, 19.3% of disabled people were employed.
In 2020, only 17.9% of disabled people were employed.
In 2019, 66.3% of non-disabled people were employed.
In 2020, 61.8% of non-disabled people were employed.Unemployment rates:
In 2019, the unemployment rate for disabled people was 7.3%
As of 2020, the unemployment rate for disabled people was 12.6%
In 2019, the unemployment rate for non-disabled people was 3.5%
As of 2020, the unemployment rate for non-disabled people was 7.9%Education:
Disabled people are less likely to have completed a Bachelor’s degree or higher education; however,
Across all educational attainment groups, unemployment rates for disabled people are higher than those for people without a disability.
Part Time:
In 2020, about 29% of employed people with disabilities worked part-time.
About 6% of this group were part-time for economic reasons; i.e., had hours reduced or couldn’t find a full-time position
In 2020, about 16% of employed people without disabilities worked part-time.
About 5% of this group were part-time for economic reasons; i.e., had hours reduced or couldn’t find a full-time position.
In the top right of the graphic is the AWN logo: a large pink “a” with a teal spoon-shaped dragonfly on it.
Image description, graphic 2:
Text is in black, pink, purple and teal and reads:
Intersectional Disability Employment Issues: Sexism, racism, and other forms of bias and discrimination are additional factors that affect many disabled people working or seeking employment.
Below, a drawing of scales used for weight measurement shows a drawing of 2 people on either side of it. Below it says “Gender Inequity” with by a bar graph on the right:“Unemployment for Disabled People: by Gender*
Bar graph shows Men = 12%, Women = 13.2%). No data was available for nonbinary disabled people
On the lower left is a drawing of 3 people connected by dashes. Beneath it says “Racial Inequity”
Across from this is a bar graph titled “Unemployment for Disabled People: by Racial Group”
Bar graph shows: Latine = 16.8%, Black = 16.3%, Asian = 15.7%, White = 11.6%
At the bottom in a purple oval reads:
“Almost two-thirds (65%) of people living in long-term poverty are people with disabilities.”
Image Description, graphic 3:
Text is in pink, purple, black and teal. It reads:
In the Workplace: Of 319 businesses participating in the 2021 Disability Equality Index, only 10% of companies have a senior executive who identifies as a person with a disability.
Below the text is a drawing of a profile of a person walking and holding a phone and briefcase. Next to them is a triangle with the tiny portion at the top filled out. Text reads:
Only 59% of businesses have a requirement to ensure digital products are accessible for disabled people.
Below this text is a pie chart, half teal half pink and a drawing of an open laptop. It reads: 37% do not yet have a process in place ensuring all contractors and subcontractors pay their employees at least minimum wage.
This text is below a drawing of a hand with cash over it and a graph showing the 37% portion.
Did You Know?
59% of workplace accommodations cost $0…while the rest typically cost only $500 per disabled employee.
Sources: US Bureau Labor Statistics; Disability Equality Index (DEI)© 2021 Autistic Women & Nonbinary Network, awnnetwork.org